Chippewa County, Michigan
Chippewa County, Michigan | ||
|---|---|---|
 Chippewa County Courthouse, Sault Ste. Marie | ||
| ||
 Location in the U.S. state of Michigan | ||
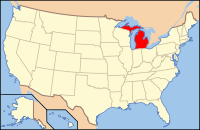 Michigan's location in the U.S. | ||
| Founded | December 22, 1826[1][2] | |
| Named for | Ojibwe people | |
| Seat | Sault Ste. Marie | |
| Largest city | Sault Ste. Marie | |
| Area | ||
| • Total | 2,698 sq mi (6,988 km2) | |
| • Land | 1,558 sq mi (4,035 km2) | |
| • Water | 1,140 sq mi (2,953 km2), 42% | |
| Population | ||
| • (2010) | 38,520 | |
| • Density | 25/sq mi (10/km2) | |
| Congressional district | 1st | |
| Time zone | Eastern | |
| Website | www.chippewacountymi.gov | |


Chippewa County, Michigan from 1904 Michigan County Maps
Chippewa County is a county in the Upper Peninsula of the U.S. state of Michigan. As of the United States 2010 Census, the population was 38,520.[3] The county seat is Sault Ste. Marie.[4] The county is named for the Ojibwe (Chippewa) people, and was set off and organized in 1826.[1]
Chippewa County comprises the Sault Ste. Marie, MI micropolitan statistical area.
Contents
1 Geography
2 Adjacent counties
2.1 National protected areas
2.2 Game areas
3 Transportation
3.1 State highways
3.2 County-designated highways
3.3 Airports
4 Demographics
5 Government
5.1 Elected officials
6 Communities
6.1 City
6.2 Village
6.3 Unincorporated communities
6.4 Townships
7 Map
8 See also
9 References
10 External links
Geography
According to the US Census Bureau, the county has a total area of 2,698 square miles (6,990 km2), of which 1,558 square miles (4,040 km2) is land and 1,140 square miles (3,000 km2) (42%) is water.[5] It is the second-largest county in Michigan by land area and fifth-largest by total area.
The Michigan Meridian runs through the eastern portion of the county. South of Nine Mile Road, M-129 (Meridian Road) overlays the meridian. In Sault Ste. Marie, Meridian Street north of 12th Avenue overlays the meridian.
Adjacent counties
Algoma District, Ontario, Canada (northeast)
Manitoulin District, Ontario, Canada (east)
Presque Isle County (southeast)
Mackinac County (south)
Luce County (west)
National protected areas
- Harbor Island National Wildlife Refuge
Hiawatha National Forest (part)
Whitefish Point Unit of the Seney National Wildlife Refuge
Game areas
The Munuscong Bay is open for hunting, boating and bird watching. The area is known for its duck hunting, including mallards, divers and green-winged teal ducks. The Bay is most known for its icefishing and duck hunting. During opening weekend of duck season (late September), hundreds of hunters come from all over the state to begin their season on the Bay.[citation needed]
This area has many types of waterfowl pass through it on their annual migrations.
Transportation
State highways
All Interstate and US Highways in Michigan, like all state-maintained highways, are part of the Michigan State Trunkline Highway System.
 I-73 (future)
 I-75 ends at the Sault Ste. Marie International Bridge at the Canada border.
 M-28
M-28
 M-48
M-48
 M-80
M-80
 M-123
M-123
 M-129
M-129
 M-134
M-134
 M-221
M-221
 BS I-75 travels from I-75 into downtown Sault Ste. Marie.


County-designated highways
The following highways are maintained by the Chippewa County Road Commission as part of the county road system. They are assigned numbers by the Michigan Department of Transportation as part of the County-Designated Highway System.
 H-40
H-40
 H-63 runs via Mackinac Trail, the former route of US 2 before it was replaced by I-75 in 1962.


The Chippewa County road commission jointly maintains Whitefish Bay National Forest Scenic Byway, a National Forest Scenic Byway with the US Forest Service.
Airports
Chippewa County International Airport (CIU) serves Chippewa county and the surrounding communities, providing commercial connection to hub airports.
Drummond Island Airport (DRM) is a public-owned, public-use general-aviation airport with 2 runways (1 hard-surfaced).
Demographics
| Historical population | |||
|---|---|---|---|
| Census | Pop. | %± | |
| 1830 | 626 | — | |
| 1840 | 534 | −14.7% | |
| 1850 | 898 | 68.2% | |
| 1860 | 1,603 | 78.5% | |
| 1870 | 1,689 | 5.4% | |
| 1880 | 5,248 | 210.7% | |
| 1890 | 12,019 | 129.0% | |
| 1900 | 21,338 | 77.5% | |
| 1910 | 24,472 | 14.7% | |
| 1920 | 24,818 | 1.4% | |
| 1930 | 25,047 | 0.9% | |
| 1940 | 27,807 | 11.0% | |
| 1950 | 29,206 | 5.0% | |
| 1960 | 32,655 | 11.8% | |
| 1970 | 32,412 | −0.7% | |
| 1980 | 29,029 | −10.4% | |
| 1990 | 34,604 | 19.2% | |
| 2000 | 38,543 | 11.4% | |
| 2010 | 38,520 | −0.1% | |
| Est. 2017 | 37,711 | [6] | −2.1% |
| US Decennial Census[7] 1790-1960[8] 1900-1990[9] 1990-2000[10] 2010-2013[3] | |||
The 2010 United States Census[11] indicates Chippewa County had a population of 38,520. This decrease of 23 people from the 2000 United States Census representa a -0.1% change in population. In 2010 there were 14,329 households and 9,106 families in the county. The population density was 24.7 per square mile (9.5 square kilometers). There were 21,253 housing units at an average density of 13.6 per square mile (5.3 square kilometers). 72.3% of the population were White, 15.8% Native American, 6.5% Black or African American, 0.6% Asian, 0.1% Pacific Islander, 0.2% of some other race and 4.6% of two or more races. 1.2% were Hispanic or Latino (of any race). 17.0% were of German, 11.8% English, 12.2% Irish, 8.8% French, 6.4% Polish ancestry.[12]
There were 14,329 households out of which 28.2% had children under the age of 18 living with them, 47.5% were husband and wife families, 10.9% had a female householder with no husband present, 36.5% were non-families, and 29.5% were made up of individuals. The average household size was 2.34 and the average family size was 2.88.
The county population contained 20.1% under age of 18, 11.0% from 18 to 24, 26.5% from 25 to 44, 27.7% from 45 to 64, and 14.6% who were 65 years of age or older. The median age was 40 years. The population was 55.1% male and 44.9% female.
The 2010 American Community Survey 3-year estimate[13] indicates the median income for a household in the county was $39,351 and the median income for a family was $54,625. Males had a median income of $25,760 versus $16,782 for females. The per capita income for the county was $19,334. About 2.3% of families and 18.6% of the population were below the poverty line, including 26.0% of those under the age 18 and 10.0% of those age 65 or over.
Government
Chippewa County voters have been reliably Republican from the start. Since 1876, they have selected the Republican Party nominee in 86% of national elections (31 of 36).
| Year | Republican | Democratic | Third Parties |
|---|---|---|---|
2016 | 58.7% 9,122 | 34.6% 5,379 | 6.8% 1,051 |
2012 | 52.9% 8,278 | 45.3% 7,100 | 1.8% 282 |
2008 | 49.5% 8,267 | 49.0% 8,184 | 1.5% 257 |
2004 | 55.3% 9,122 | 43.7% 7,203 | 1.0% 163 |
2000 | 52.4% 7,526 | 44.4% 6,370 | 3.2% 458 |
1996 | 38.7% 5,137 | 49.3% 6,532 | 12.0% 1,590 |
1992 | 40.0% 5,462 | 39.8% 5,434 | 20.2% 2,751 |
1988 | 56.2% 6,786 | 43.3% 5,222 | 0.5% 60 |
1984 | 63.8% 8,135 | 35.9% 4,575 | 0.4% 47 |
1980 | 52.3% 7,059 | 39.0% 5,268 | 8.7% 1,167 |
1976 | 53.3% 7,025 | 45.7% 6,022 | 1.0% 128 |
1972 | 59.0% 7,028 | 39.9% 4,744 | 1.1% 134 |
1968 | 52.0% 5,359 | 40.1% 4,132 | 7.8% 806 |
1964 | 38.5% 4,098 | 61.3% 6,537 | 0.2% 23 |
1960 | 55.2% 6,490 | 44.6% 5,239 | 0.2% 22 |
1956 | 62.8% 6,957 | 37.1% 4,106 | 0.1% 14 |
1952 | 62.1% 7,075 | 37.4% 4,257 | 0.5% 57 |
1948 | 53.3% 4,977 | 41.4% 3,860 | 5.3% 494 |
1944 | 54.9% 5,335 | 44.7% 4,344 | 0.5% 46 |
1940 | 51.5% 5,851 | 48.2% 5,473 | 0.3% 29 |
1936 | 47.1% 4,901 | 50.6% 5,259 | 2.3% 238 |
1932 | 54.3% 5,252 | 43.7% 4,221 | 2.0% 192 |
1928 | 68.7% 5,326 | 30.4% 2,355 | 1.0% 74 |
1924 | 77.4% 5,443 | 7.3% 516 | 15.2% 1,070 |
1920 | 74.4% 4,732 | 19.9% 1,266 | 5.8% 366 |
1916 | 54.6% 2,365 | 40.9% 1,768 | 4.5% 195 |
1912 | 23.3% 889 | 23.1% 879 | 53.6% 2,046 |
1908 | 64.2% 2,418 | 31.2% 1,175 | 4.6% 174 |
1904 | 77.8% 2,920 | 17.6% 662 | 4.6% 172 |
1900 | 71.6% 2,477 | 25.8% 893 | 2.6% 90 |
1896 | 65.5% 2,105 | 31.2% 1,001 | 3.3% 107 |
1892 | 52.3% 1,247 | 45.5% 1,083 | 2.2% 53 |
1888 | 51.6% 1,055 | 44.4% 909 | 4.0% 82 |
1884 | 51.1% 686 | 47.3% 635 | 1.6% 21 |
1880 | 53.2% 396 | 46.6% 347 | 0.3% 2 |
1876 | 37.8% 172 | 62.2% 283 | 0.0% 0 |
The county government operates the jail, maintains rural roads, operates the major local courts, records deeds, mortgages, and vital records, administers public health regulations, and participates with the state in the provision of social services. The county board of commissioners controls the budget and has limited authority to make laws or ordinances. In Michigan, most local government functions — police and fire, building and zoning, tax assessment, street maintenance, etc. — are the responsibility of individual cities and townships.
Elected officials
Prosecuting Attorney: Robert L. Stratton
Sheriff: Michael Bitnar
County Clerk: Cathy Maleport
County Treasurer: Marjorie Hank
Register of Deeds: Sharon H. Kennedy
Drain Commissioner: Anthony Stackpoole
County Surveyor: William Karr[15]
(Current as of October 2018)[16]
Communities
City
Sault Ste. Marie (county seat)
Village
- De Tour Village
Unincorporated communities
- Barbeau
- Bay Mills
Bay Mills Indian Community (Indian Reservation)
Brimley (named Superior until 1896)
Dafter (named Stevensburg until 1893)- Drummond
- Eckerman
- Emerson
Goetzville (named Gatesville until 1917)- Homestead
- Johnswood
- Hulbert
Kelden (also spelled Keldon)- Kincheloe
- Kinross
- Mission
- Neebish Island
- Paradise
- Pickford
- Raber
- Raco
Rudyard (named Pine River until 1890)
Shelldrake (Ghost town)- Stalwart
Stirlingville (named Jolly's Landing until 1888)- Strongs
- Trout Lake
- Whitefish Point
- Vermilion
Townships
- Bay Mills Township
- Bruce Township
- Chippewa Township
- Dafter Township
- Detour Township
- Drummond Township
- Hulbert Township
- Kinross Charter Township
- Pickford Township
- Raber Township
- Rudyard Township
- Soo Township
- Sugar Island Township
- Superior Township
- Trout Lake Township
- Whitefish Township
Map

Township
Township
Township
Township
Township
Township
Township
De Tour •
(Soo Township)
 Brimley State Park Tahquamenon Falls State Park

 Soo Locks
Barbeau •
Bay Mills •
Dollar Settlement •
Brimley •
Dafter •
Keldon •
Kincheloe •
Eckerman •
Raber •
Goetzville •
Stalwart •
Raco •
See also
- Delirium Wilderness
- List of Michigan State Historic Sites in Chippewa County, Michigan
- National Register of Historic Places listings in Chippewa County, Michigan
References
^ ab "Bibliography on Chippewa County". Clarke Historical Library, Central Michigan University. Retrieved July 17, 2013..mw-parser-output cite.citation{font-style:inherit}.mw-parser-output q{quotes:"""""""'""'"}.mw-parser-output code.cs1-code{color:inherit;background:inherit;border:inherit;padding:inherit}.mw-parser-output .cs1-lock-free a{background:url("//upload.wikimedia.org/wikipedia/commons/thumb/6/65/Lock-green.svg/9px-Lock-green.svg.png")no-repeat;background-position:right .1em center}.mw-parser-output .cs1-lock-limited a,.mw-parser-output .cs1-lock-registration a{background:url("//upload.wikimedia.org/wikipedia/commons/thumb/d/d6/Lock-gray-alt-2.svg/9px-Lock-gray-alt-2.svg.png")no-repeat;background-position:right .1em center}.mw-parser-output .cs1-lock-subscription a{background:url("//upload.wikimedia.org/wikipedia/commons/thumb/a/aa/Lock-red-alt-2.svg/9px-Lock-red-alt-2.svg.png")no-repeat;background-position:right .1em center}.mw-parser-output .cs1-subscription,.mw-parser-output .cs1-registration{color:#555}.mw-parser-output .cs1-subscription span,.mw-parser-output .cs1-registration span{border-bottom:1px dotted;cursor:help}.mw-parser-output .cs1-hidden-error{display:none;font-size:100%}.mw-parser-output .cs1-visible-error{font-size:100%}.mw-parser-output .cs1-subscription,.mw-parser-output .cs1-registration,.mw-parser-output .cs1-format{font-size:95%}.mw-parser-output .cs1-kern-left,.mw-parser-output .cs1-kern-wl-left{padding-left:0.2em}.mw-parser-output .cs1-kern-right,.mw-parser-output .cs1-kern-wl-right{padding-right:0.2em}
^ Chapman, C.H. (February 23, 1893). "Early History of Chippewa County: Lore of Old" (PDF). Lansing MI: The News/Chippewa County Government. Retrieved February 25, 2013.
^ ab "State & County QuickFacts". US Census Bureau. Retrieved August 27, 2013.
^ "Find a County". National Association of Counties. Retrieved June 7, 2011.
^ "2010 Census Gazetteer Files". US Census Bureau. August 22, 2012. Retrieved September 19, 2014.
^ "Population and Housing Unit Estimates". Retrieved June 9, 2017.
^ "US Decennial Census". US Census Bureau. Retrieved September 19, 2014.
^ "Historical Census Browser". University of Virginia Library. Retrieved September 19, 2014.
^ "Population of Counties by Decennial Census: 1900 to 1990". US Census Bureau. Retrieved September 19, 2014.
^ "Census 2000 PHC-T-4. Ranking Tables for Counties: 1990 and 2000" (PDF). US Census Bureau. Retrieved September 19, 2014.
^ "Census 2010 American Fact Finder". Retrieved July 6, 2013.
^ Data Access and Dissemination Systems (DADS). "American FactFinder". census.gov.
^ "American Factfinder". US Census Bureau. Retrieved March 11, 2012.
^ US Election Atlas
^ "Press Release: NCEES honors Michigan surveyor William Karr for service" (PDF). National Council of Examiners for Engineering and Surveying. Retrieved February 25, 2013.
^ Chippewa County website
External links
- Chippewa County Government
- Chippewa County Profile, Sam M Cohodas Regional Economist
"Bibliography on Chippewa County". Clarke Historical Library, Central Michigan University.
Places adjacent to Chippewa County, Michigan | ||||||||||
|---|---|---|---|---|---|---|---|---|---|---|
| ||||||||||

 Chippewa County, Michigan

Municipalities and communities of Chippewa County, Michigan, United States | ||
|---|---|---|
County seat: Sault Ste. Marie | ||
| City |
|  |
| Village |
| |
| Charter township |
| |
| General law townships |
| |
| Unincorporated communities |
| |
| Indian reservations |
| |
| Ghost towns |
| |
Upper Peninsula of Michigan | |
|---|---|
| Central cities |
|
| Counties |
|
| Geography |
|
| Transportation |
|
| Economy |
|
| |
 State of Michigan State of Michigan | ||
|---|---|---|
Lansing (capital) | ||
| Topics |
|  |
| Society |
| |
| Regions |
| |
| Largest municipalities |
| |
| Counties |
| |
Coordinates: 46°19′N 84°31′W / 46.32°N 84.52°W / 46.32; -84.52

