2015 Spanish regional elections
| |||
Regional assemblies of Aragon, Asturias, the Balearic Islands, the Canary Islands, Cantabria, Castile and León, Castilla–La Mancha, Extremadura, La Rioja, Madrid, Murcia, Navarre and the Valencian Community | |||
|---|---|---|---|
| Registered | 19,834,729 | ||
| Turnout | 12,976,335 (65.4%) | ||
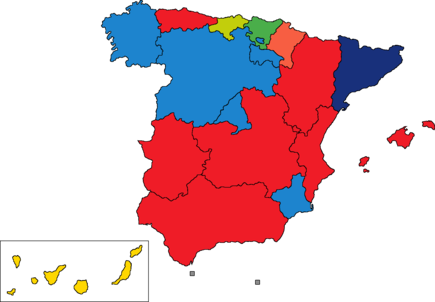 Regional administrations after the 2015 regional elections
| |||
The 2015 Spanish regional elections were held on Sunday, 24 May 2015, to elect the regional parliaments of thirteen of the seventeen autonomous communities—Aragon, Asturias, the Balearic Islands, the Canary Islands, Cantabria, Castile and León, Castilla–La Mancha, Extremadura, La Rioja, Madrid, Murcia, Navarre and the Valencian Community—, not including Andalusia, the Basque Country, Catalonia and Galicia, which had separate electoral cycles. 804 of 1,198 seats in the regional parliaments were up for election. The elections were held simultaneously with local elections all throughout Spain.
The ruling People's Party (PP) suffered one of the harshest loss of votes for any party in the quadrennial regional elections, losing all of its absolute majorities and most of the regional administrations at stake, including notable PP strongholds such as the Valencian Community which it had held continuously since 1995. The Spanish Socialist Workers' Party (PSOE) was unable to capitalize on the PP backlash and kept losing votes from 2011. However, through post-election agreements with other left-wing parties it was able to recapture all of the regional governments it had lost four years previously, as well as gain the Valencian regional government.
The novelty of these elections was the irruption of two new parties: Podemos (Spanish: We can), a party founded in 2014 before the May European Parliament election, and Citizens (C's), a Catalan unionist party created in 2006 to run in Parliament of Catalonia elections. Podemos obtained a strong third place, close to the two main parties in several regions and entering in all regional parliaments—a first for any party aside from PP and PSOE—, while C's placed fourth in most regions, being left out from regional assemblies in the Canary Islands, Castilla–La Mancha and Navarre.
Contents
1 Election date
2 Regional governments
3 Overall results
4 Summary by region
4.1 Aragon
4.2 Asturias
4.3 Balearic Islands
4.4 Canary Islands
4.5 Cantabria
4.6 Castile and León
4.7 Castilla–La Mancha
4.8 Extremadura
4.9 La Rioja
4.10 Madrid
4.11 Murcia
4.12 Navarre
4.13 Valencian Community
5 References
6 External links
Election date
Determination of election day varied depending on the autonomous community, with each one having competency to establish its own regulations. Typically, thirteen out of the seventeen autonomous communities—all but Andalusia, the Basque Country, Catalonia and Galicia—had their elections fixed for the fourth Sunday of May every four years, to be held together with nationwide local elections.[1][2]
In some cases, regional presidents had the prerogative to dissolve the regional parliament and call for extra elections at a different time, but newly elected assemblies were restricted to serving out what remained of their previous four year-terms without altering the period to their next ordinary election. In other cases—namely, Aragon, the Balearic Islands, Castile and León, Extremadura, Navarre and the Valencian Community—, the law granted presidents the power to call a snap election resulting in a fresh four year-parliamentary term.[3] By the time of the 2015 regional elections, however, this prerogative had not yet been exercised by any of these communities.
Regional governments
The following table lists party control in autonomous communities. Gains for a party are highlighted in that party's colour.
| Autonomous community | Previous control | New control | ||
|---|---|---|---|---|
Aragon | People's Party (PP) | Spanish Socialist Workers' Party (PSOE) | ||
Asturias | Spanish Socialist Workers' Party (PSOE) | Spanish Socialist Workers' Party (PSOE) | ||
Balearic Islands | People's Party (PP) | Spanish Socialist Workers' Party (PSOE) | ||
Canary Islands | Canarian Coalition (CC) | Canarian Coalition (CC) | ||
Cantabria | People's Party (PP) | Regionalist Party of Cantabria (PRC) | ||
Castile and León | People's Party (PP) | People's Party (PP) | ||
Castilla–La Mancha | People's Party (PP) | Spanish Socialist Workers' Party (PSOE) | ||
Extremadura | People's Party (PP) | Spanish Socialist Workers' Party (PSOE) | ||
La Rioja | People's Party (PP) | People's Party (PP) | ||
Madrid | People's Party (PP) | People's Party (PP) | ||
Murcia | People's Party (PP) | People's Party (PP) | ||
Navarre | Navarrese People's Union (UPN) | Geroa Bai (GBai) | ||
Valencian Community | People's Party (PP) | Spanish Socialist Workers' Party (PSOE) | ||
Overall results
| Parties and coalitions | Votes | % | Seats | |
|---|---|---|---|---|
People's Party (PP) | 3,888,407 | 30.43 | 281 | |
Spanish Socialist Workers' Party (PSOE) | 3,173,671 | 24.84 | 227 | |
We Can (Podemos) | 1,813,667 | 14.19 | 118 | |
Citizens–Party of the Citizenry (C's) | 1,271,755 | 9.95 | 56 | |
United Left–Let's Win (IU–G) | 537,225 | 4.20 | 9 | |
Commitment Coalition (Compromís) | 456,823 | 3.57 | 19 | |
Canarian Coalition–Nationalist Party (CCa–PNC) | 166,979 | 1.31 | 18 | |
Regionalist Party of Cantabria (PRC) | 97,185 | 0.76 | 12 | |
New Canaries (NCa) | 93,634 | 0.73 | 5 | |
Navarrese People's Union (UPN) | 92,705 | 0.73 | 15 | |
| More (Més–MpM) | 66,199 | 0.52 | 9 | |
Yes to the Future (GBai) | 53,497 | 0.42 | 9 | |
Basque Country Unite (EH Bildu) | 48,166 | 0.38 | 8 | |
Aragonese Party (PAR) | 45,846 | 0.36 | 6 | |
Asturias Forum (FAC) | 44,480 | 0.35 | 3 | |
Proposal for the Isles (El Pi) | 34,237 | 0.27 | 3 | |
Aragonese Union (CHA) | 30,618 | 0.24 | 2 | |
Leonese People's Union (UPL) | 19,176 | 0.15 | 1 | |
Gomera Socialist Group (ASG) | 5,090 | 0.04 | 3 | |
| Others | 636,291 | 4.98 | 0 | |
| Blank ballots | 202,999 | 1.59 | ||
| Valid votes | 12,778,650 | 98.48 | ||
| Invalid votes | 197,685 | 1.52 | ||
| Votes cast / turnout | 12,976,335 | 65.42 | ||
| Registered voters | 19,834,729 | |||
Summary by region

Aragon

Cortes of Aragon after the election.
| List | Votes | % | Seats | ||
|---|---|---|---|---|---|
PP | 183,654 | 27.50 | 21 | ||
PSOE | 143,096 | 21.43 | 18 | ||
Podemos | 137,325 | 20.56 | 14 | ||
C's | 62,907 | 9.42 | 5 | ||
PAR | 45,846 | 6.86 | 6 | ||
CHA | 30,618 | 4.58 | 2 | ||
IU | 28,184 | 4.22 | 1 | ||
| Others | 23,004 | 3.44 | 0 | ||
| Blank ballots | 13,224 | 1.98 | |||
| Valid votes | 667,858 | 98.70 | |||
| Invalid votes | 8,796 | 1.30 | |||
| Votes cast / turnout | 676,654 | 66.33 | |||
| Registered voters | 1,020,106 | ||||
Asturias

General Junta of Asturias after the election.
| List | Votes | % | Seats | ||
|---|---|---|---|---|---|
PSOE | 143,851 | 26.48 | 14 | ||
PP | 117,319 | 21.59 | 11 | ||
Podemos | 103,571 | 19.06 | 9 | ||
IU/IX | 64,868 | 11.94 | 5 | ||
FAC | 44,480 | 8.19 | 3 | ||
C's | 38,687 | 7.12 | 3 | ||
| Others | 20,298 | 3.74 | 0 | ||
| Blank ballots | 10,271 | 1.89 | |||
| Valid votes | 543,345 | 98.58 | |||
| Invalid votes | 7,847 | 1.42 | |||
| Votes cast / turnout | 551,192 | 55.79 | |||
| Registered voters | 988,057 | ||||
Balearic Islands

Parliament of the Balearic Islands after the election.
| List | Votes | % | Seats | ||
|---|---|---|---|---|---|
PP | 123,183 | 28.52 | 20 | ||
PSOE–GxF | 83,804 | 19.41 | 15 | ||
Més–MpM | 66,199 | 15.32 | 9 | ||
Podemos/Podem | 63,489 | 14.70 | 10 | ||
El Pi | 34,237 | 7.93 | 3 | ||
C's–UPCM | 27,589 | 6.39 | 2 | ||
| Others | 24,236 | 5.61 | 0 | ||
| Blank ballots | 8,080 | 1.87 | |||
| Valid votes | 431,859 | 98.63 | |||
| Invalid votes | 5,979 | 1.37 | |||
| Votes cast / turnout | 437,838 | 57.13 | |||
| Registered voters | 766,383 | ||||
Canary Islands
Parliament of the Canary Islands after the election.
| List | Votes | % | Seats | ||
|---|---|---|---|---|---|
PSOE | 182,006 | 19.89 | 15 | ||
PP | 170,129 | 18.59 | 12 | ||
CCa–PNC | 166,979 | 18.25 | 18 | ||
Podemos | 133,044 | 14.54 | 7 | ||
NCa | 93,634 | 10.23 | 5 | ||
ASG | 5,090 | 0.56 | 3 | ||
| Others | 147,455 | 16.11 | 0 | ||
| Blank ballots | 16,769 | 1.83 | |||
| Valid votes | 915,106 | 98.20 | |||
| Invalid votes | 16,770 | 1.80 | |||
| Votes cast / turnout | 931,876 | 56.09 | |||
| Registered voters | 1,661,272 | ||||
Cantabria

Parliament of Cantabria after the election.
| List | Votes | % | Seats | ||
|---|---|---|---|---|---|
PP | 105,944 | 32.58 | 13 | ||
PRC | 97,185 | 29.89 | 12 | ||
PSOE | 45,653 | 14.04 | 5 | ||
Podemos | 28,895 | 8.89 | 3 | ||
C's | 22,552 | 6.94 | 2 | ||
| Others | 19,879 | 6.11 | 0 | ||
| Blank ballots | 5,025 | 1.55 | |||
| Valid votes | 325,133 | 98.27 | |||
| Invalid votes | 5,735 | 1.73 | |||
| Votes cast / turnout | 330,868 | 66.23 | |||
| Registered voters | 499,596 | ||||
Castile and León

Cortes of Castile and León after the election.
| List | Votes | % | Seats | ||
|---|---|---|---|---|---|
PP | 514,301 | 37.73 | 42 | ||
PSOE | 353,575 | 25.94 | 25 | ||
Podemos | 165,475 | 12.14 | 10 | ||
C's | 139,954 | 10.27 | 5 | ||
IU–eQuo | 56,516 | 4.15 | 1 | ||
UPL | 19,176 | 1.41 | 1 | ||
| Others | 80,784 | 5.93 | 0 | ||
| Blank ballots | 33,274 | 2.44 | |||
| Valid votes | 1,363,055 | 97.93 | |||
| Invalid votes | 28,742 | 2.07 | |||
| Votes cast / turnout | 1,391,797 | 64.87 | |||
| Registered voters | 2,145,628 | ||||
Castilla–La Mancha

Cortes of Castilla–La Mancha after the election.
| List | Votes | % | Seats | ||
|---|---|---|---|---|---|
PP | 413,349 | 37.49 | 16 | ||
PSOE | 398,104 | 36.11 | 15 | ||
Podemos | 107,463 | 9.75 | 2 | ||
| Others | 164,356 | 14.91 | 0 | ||
| Blank ballots | 19,256 | 1.75 | |||
| Valid votes | 1,102,528 | 97.82 | |||
| Invalid votes | 24,619 | 2.18 | |||
| Votes cast / turnout | 1,127,147 | 71.50 | |||
| Registered voters | 1,576,351 | ||||
Extremadura

Assembly of Extremadura after the election.
| List | Votes | % | Seats | ||
|---|---|---|---|---|---|
PSOE–SIEx | 265,015 | 41.50 | 30 | ||
PP | 236,266 | 37.00 | 28 | ||
Podemos | 51,216 | 8.02 | 6 | ||
C's | 28,010 | 4.39 | 1 | ||
| Others | 49,572 | 7.76 | 0 | ||
| Blank ballots | 8,561 | 1.34 | |||
| Valid votes | 638,640 | 98.14 | |||
| Invalid votes | 12,134 | 1.86 | |||
| Votes cast / turnout | 650,774 | 71.40 | |||
| Registered voters | 911,433 | ||||
La Rioja

Parliament of La Rioja after the election.
| List | Votes | % | Seats | ||
|---|---|---|---|---|---|
PP | 63,094 | 38.62 | 15 | ||
PSOE | 43,689 | 26.74 | 10 | ||
Podemos | 18,319 | 11.21 | 4 | ||
C's | 17,042 | 10.43 | 4 | ||
| Others | 18,290 | 11.20 | 0 | ||
| Blank ballots | 2,933 | 1.80 | |||
| Valid votes | 163,367 | 98.03 | |||
| Invalid votes | 3,282 | 1.97 | |||
| Votes cast / turnout | 166,649 | 67.29 | |||
| Registered voters | 247,663 | ||||
Madrid
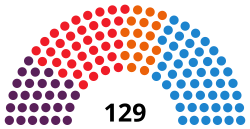
Assembly of Madrid after the election.
| List | Votes | % | Seats | ||
|---|---|---|---|---|---|
PP | 1,050,256 | 33.08 | 48 | ||
PSOE | 807,385 | 25.43 | 37 | ||
Podemos | 591,697 | 18.64 | 27 | ||
C's | 385,836 | 12.15 | 17 | ||
| Others | 304,684 | 9.60 | 0 | ||
| Blank ballots | 34,856 | 1.10 | |||
| Valid votes | 3,174,714 | 99.03 | |||
| Invalid votes | 31,217 | 0.97 | |||
| Votes cast / turnout | 3,205,931 | 65.69 | |||
| Registered voters | 4,880,495 | ||||
Murcia

Regional Assembly of Murcia after the election.
| List | Votes | % | Seats | ||
|---|---|---|---|---|---|
PP | 239,011 | 37.35 | 22 | ||
PSOE | 153,231 | 23.95 | 13 | ||
Podemos | 84,577 | 13.22 | 6 | ||
C's | 80,459 | 12.57 | 4 | ||
| Others | 72,557 | 11.34 | 0 | ||
| Blank ballots | 10,057 | 1.57 | |||
| Valid votes | 639,892 | 98.00 | |||
| Invalid votes | 13,087 | 2.00 | |||
| Votes cast / turnout | 652,977 | 63.57 | |||
| Registered voters | 1,027,213 | ||||

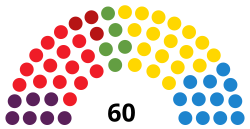
Parliament of Navarre after the election.
| List | Votes | % | Seats | ||
|---|---|---|---|---|---|
UPN | 92,705 | 27.44 | 15 | ||
GBai | 53,497 | 15.83 | 9 | ||
EH Bildu | 48,166 | 14.25 | 8 | ||
Podemos | 46,207 | 13.67 | 7 | ||
PSN–PSOE | 45,164 | 13.37 | 7 | ||
PP | 13,289 | 3.93 | 2 | ||
I–E | 12,482 | 3.69 | 2 | ||
| Others | 19,775 | 5.85 | 0 | ||
| Blank ballots | 6,610 | 1.96 | |||
| Valid votes | 337,895 | 98.75 | |||
| Invalid votes | 4,278 | 1.25 | |||
| Votes cast / turnout | 342,173 | 68.26 | |||
| Registered voters | 501,267 | ||||
Valencian Community

Corts Valencianes after the election.
| List | Votes | % | Seats | ||
|---|---|---|---|---|---|
PP | 658,612 | 26.61 | 31 | ||
PSPV–PSOE | 509,098 | 20.57 | 23 | ||
Compromís | 456,823 | 18.46 | 19 | ||
C's | 309,121 | 12.49 | 13 | ||
Podemos | 282,389 | 11.41 | 13 | ||
| Others | 225,132 | 9.10 | 0 | ||
| Blank ballots | 34,083 | 1.38 | |||
| Valid votes | 2,475,258 | 98.60 | |||
| Invalid votes | 35,201 | 1.40 | |||
| Votes cast / turnout | 2,510,459 | 69.56 | |||
| Registered voters | 3,609,265 | ||||
References
^ "General Electoral System Organic Law of 1985". Organic Law No. 5 of 19 June 1985. Official State Gazette (in Spanish). Retrieved 28 December 2016..mw-parser-output cite.citation{font-style:inherit}.mw-parser-output .citation q{quotes:"""""""'""'"}.mw-parser-output .citation .cs1-lock-free a{background:url("//upload.wikimedia.org/wikipedia/commons/thumb/6/65/Lock-green.svg/9px-Lock-green.svg.png")no-repeat;background-position:right .1em center}.mw-parser-output .citation .cs1-lock-limited a,.mw-parser-output .citation .cs1-lock-registration a{background:url("//upload.wikimedia.org/wikipedia/commons/thumb/d/d6/Lock-gray-alt-2.svg/9px-Lock-gray-alt-2.svg.png")no-repeat;background-position:right .1em center}.mw-parser-output .citation .cs1-lock-subscription a{background:url("//upload.wikimedia.org/wikipedia/commons/thumb/a/aa/Lock-red-alt-2.svg/9px-Lock-red-alt-2.svg.png")no-repeat;background-position:right .1em center}.mw-parser-output .cs1-subscription,.mw-parser-output .cs1-registration{color:#555}.mw-parser-output .cs1-subscription span,.mw-parser-output .cs1-registration span{border-bottom:1px dotted;cursor:help}.mw-parser-output .cs1-ws-icon a{background:url("//upload.wikimedia.org/wikipedia/commons/thumb/4/4c/Wikisource-logo.svg/12px-Wikisource-logo.svg.png")no-repeat;background-position:right .1em center}.mw-parser-output code.cs1-code{color:inherit;background:inherit;border:inherit;padding:inherit}.mw-parser-output .cs1-hidden-error{display:none;font-size:100%}.mw-parser-output .cs1-visible-error{font-size:100%}.mw-parser-output .cs1-maint{display:none;color:#33aa33;margin-left:0.3em}.mw-parser-output .cs1-subscription,.mw-parser-output .cs1-registration,.mw-parser-output .cs1-format{font-size:95%}.mw-parser-output .cs1-kern-left,.mw-parser-output .cs1-kern-wl-left{padding-left:0.2em}.mw-parser-output .cs1-kern-right,.mw-parser-output .cs1-kern-wl-right{padding-right:0.2em}
^ "Representation of the people Institutional Act". juntaelectoralcentral.es. Central Electoral Commission. Retrieved 16 June 2017.
^ "Un paso más hacia la ruptura de la homogeneidad del calendario electoral de las comunidades autónomas: la reforma de la Ley Orgánica 13/1982, de 10 de agosto, de Reintegración y Amejoramiento del Régimen Foral de Navarra" [A further step towards breaking the homogeneity of the electoral calendar of the autonomous communities: the reform of the Organic Law 13/1982, of August 10, on Reintegration and Improvement of the Foral Regime of Navarre] (PDF). gencat.cat (in Spanish). Institut d'Estudis Autonòmics. Archived from the original on 2 April 2015. Retrieved 5 September 2017.CS1 maint: BOT: original-url status unknown (link)
External links
Junta Electoral Central – Elecciones Autonómicas (in Spanish)
Portal de Información Argos – Archivo Histórico Electoral (in Spanish)
Historia Electoral – Eleccions Autonòmiques des de 1980 (in Spanish and Catalan)
| General elections |
|
|---|---|
| European elections |
|
| Local elections |
|
| Regional elections |
|
| Referendums |
|
| |


