1918 United Kingdom general election
| |||||||||||||||||||||||||||||||||||||||||||||||||||||||||||||||||||||||||||||||||||||||||||||||||||||
All 707 seats in the House of Commons 354 seats needed for a majority | |||||||||||||||||||||||||||||||||||||||||||||||||||||||||||||||||||||||||||||||||||||||||||||||||||||
|---|---|---|---|---|---|---|---|---|---|---|---|---|---|---|---|---|---|---|---|---|---|---|---|---|---|---|---|---|---|---|---|---|---|---|---|---|---|---|---|---|---|---|---|---|---|---|---|---|---|---|---|---|---|---|---|---|---|---|---|---|---|---|---|---|---|---|---|---|---|---|---|---|---|---|---|---|---|---|---|---|---|---|---|---|---|---|---|---|---|---|---|---|---|---|---|---|---|---|---|---|---|
| Turnout | 57.2% | ||||||||||||||||||||||||||||||||||||||||||||||||||||||||||||||||||||||||||||||||||||||||||||||||||||
| |||||||||||||||||||||||||||||||||||||||||||||||||||||||||||||||||||||||||||||||||||||||||||||||||||||
 Colours denote the winning party—as shown in § Results | |||||||||||||||||||||||||||||||||||||||||||||||||||||||||||||||||||||||||||||||||||||||||||||||||||||
| |||||||||||||||||||||||||||||||||||||||||||||||||||||||||||||||||||||||||||||||||||||||||||||||||||||

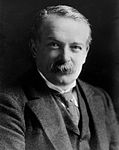


The 1918 United Kingdom general election was called immediately after the Armistice with Germany which ended the First World War, and was held on Saturday 14 December 1918. The governing coalition, under Prime Minister David Lloyd George, sent letters of endorsement to candidates who supported the coalition government. These were nicknamed "Coalition Coupons", and led to the election being known as the "coupon election". The result was a massive landslide in favour of the coalition, comprising primarily the Conservatives and Coalition Liberals, with massive losses for Liberals who were not endorsed.[1] Nearly all the Liberal M.P.s without coupons were defeated, although party leader H.H. Asquith managed to return to Parliament in a bye- election. [2]
It was the first general election to include on a single day all eligible voters of the United Kingdom, although the vote count was delayed until 28 December so that the ballots cast by soldiers serving overseas could be included in the tallies.[3]
It resulted in a landslide victory for the coalition government of David Lloyd George, who had replaced H. H. Asquith as Prime Minister in December 1916. They were both Liberals and continued to battle for control of the party, which was fast losing popular support and never regained power.[4]
It was the first general election to be held after enactment of the Representation of the People Act 1918. It was thus the first election in which women over the age of 30, and all men over the age of 21, could vote. Previously, all women and many poor men had been excluded from voting. Women showed enormous patriotism, and generally supported the coalition candidates.[5]
The election was also noted for the dramatic result in Ireland, which showed clear disapproval of government policy. The Irish Parliamentary Party were almost completely wiped out by the Irish republican party Sinn Féin, who vowed in their manifesto to establish an independent Irish Republic. They refused to take their seats in Westminster, instead forming a breakaway government and declaring Irish independence. The Irish War of Independence began soon after the election.
|
|
|
|
|
Contents
1 Background
2 Coalition victory
3 Ireland
4 Results
4.1 Seats by party
4.2 Votes summary
4.3 Seats summary
4.4 Maps
5 Transfers of seats
6 See also
7 Notes
8 References
9 Further reading
10 External links
10.1 Manifestos
Background
Lloyd George's coalition government was supported by the majority of the Liberals and Bonar Law's Conservatives. However, the election saw a split in the Liberal Party between those who were aligned with Lloyd George and the government and those who were aligned with Asquith, the party's official leader.
On 14 November it was announced that Parliament, which had been sitting since 1910 and had been extended by emergency wartime action, would dissolve on 25 November, with elections on 14 December.[6]
Following confidential negotiations over the summer of 1918, it was agreed that certain candidates were to be offered the support of the Prime Minister and the leader of the Conservative Party at the next general election. To these candidates a letter, known as the Coalition Coupon, was sent, indicating the government's endorsement of their candidacy. 159 Liberal, 364 Conservative, 20 National Democratic and Labour, and 2 Coalition Labour candidates received the coupon. For this reason the election is often called the Coupon Election.[7]
80 Conservative candidates stood without a coupon. Of these, 35 candidates were Irish Unionists. Of the other non-couponed Conservative candidates, only 23 stood against a Coalition candidate; the remaining 22 candidates stood in areas where there were no coupons, or refused the offer of a coupon.[8]
The Labour Party, led by William Adamson, fought the election independently, as did those Liberals who did not receive a coupon.
The election was not chiefly fought over what peace to make with Germany, although those issues played a role. More important was the voters' evaluation of Lloyd George in terms of what he had accomplished so far and what he promised for the future. His supporters emphasised that he had won the Great War. Against his strong record in social legislation, he called for making "a country fit for heroes to live in".[9]
This election was known as a khaki election, due to the immediate postwar setting and the role of the demobilised soldiers.
Coalition victory
The coalition won the election easily, with the Conservatives the big winners. They were the largest party in the governing majority. Lloyd George remained Prime Minister, despite the Conservatives outnumbering his pro-coalition Liberals. The Conservatives welcomed his leadership on foreign policy as the Paris Peace talks began a few weeks after the election.[10]
An additional 47 Conservatives, 23 of whom were Irish Unionists, won without the coupon but did not act as a separate block or oppose the government except on the issue of Irish independence.
While most of the pro-coalition Liberals were re-elected, Asquith's faction was reduced to just 36 seats and lost all their leaders from parliament; Asquith himself lost his own seat. Nine of these MPs subsequently joined the Coalition Liberal group. The remainder became bitter enemies of Lloyd George,[11]
The Labour Party greatly increased its vote share, surpassing the total votes of either Liberal party, and became the Official Opposition for the first time. However, they only slightly increased their number of seats, and lost some of their earlier leaders like Ramsay MacDonald and Arthur Henderson. Labour won the most seats in Wales (which had previously been dominated by the Liberals) for the first time, a feat it has continued to the present day.[12]
The Conservative MPs included record numbers of corporate directors, bankers and businessmen, while Labour MPs were mostly from the working class. Bonar Law himself symbolised the change in the type of a Conservative MP as Bonar Law was a Presbyterian Canadian-born Scottish businessman who became in the words of his biographer, Robert Blake, the leader of "the Party of Old England, the Party of the Anglican Church and the country squire, the party of broad acres and hereditary titles".[13] Bonar Law's ascent as leader of the Conservative marked a shift in Conservative leaders from the aristocrats who generally led the party in the 19th century to a more middle class leadership who usually led the party in the 20th century.[14] Many young veterans reacted against the harsh tone of the campaign and became disillusioned with politics.[15]
Ireland
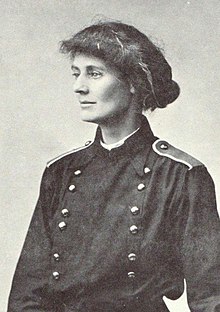
Constance Markievicz was the first woman elected to the House of Commons, but as an Irish nationalist she did not take her seat at Westminster.
In Ireland, the Irish Parliamentary Party which favoured Home Rule within the United Kingdom lost almost all their seats, most of which were won by Sinn Féin under Éamon de Valera, which called for independence. The executions of many of the leaders of the Easter uprising of 1916, the force-feeding of those imprisoned in connection with the uprising who had gone on a hunger strike in 1917, and the Conscription Crisis of 1918 all served to alienate Irish Catholic opinion from the United Kingdom.[16] The Sinn Féin candidates had promised on the campaign trail to win an Irish republic "by any means necessary", which was a code-word for violence, though it is not entirely clear if all Irish voters understood what the phrase meant.[17] The 73 Sinn Féin elected members declined to take their seats in the British House of Commons, sitting instead in the Irish revolutionary assembly, the Dáil Éireann. On 17 May 1918 almost the entire leadership of Sinn Féin, including de Valera and Arthur Griffith, had been arrested. In total 47 of the Sinn Féin MPs were elected from jail. The Dáil first convened on 21 January 1919, which marks the beginning of the Irish War of Independence.
In the six Ulster counties that became Northern Ireland, Unionists consolidated their position by winning 23 out of the 30 seats. Cardinal Logue brokered a pact in eight seats (one, East Donegal, not in the six counties), after nominations closed, where Catholic voters were instructed to vote for one particular nationalist party. Split evenly, the Irish Parliamentary Party won three of those seats and Sinn Féin three. (The pact failed in East Down). Joe Devlin, memorably, also won Belfast (Falls) for the Irish Parliamentary Party in a straight fight with Éamon de Valera of Sinn Féin.
Constance Markievicz became the first woman elected to Parliament. She was a Sinn Féin member elected for Dublin St Patrick's, and like the other Sinn Féin MPs, did not take her seat.
Results
Seats by party
382 | 127 | 73 | 57 | 36 | 35 |
Conservative | Coal Lib | SF | Lab | Lib | O |
| Candidates | Votes | ||||||||||
|---|---|---|---|---|---|---|---|---|---|---|---|
| Party | Leader | Stood | Elected | Gained | Unseated | Net | % of total | % | No. | Net % | |
Coalition Government[b] | |||||||||||
| | Conservative | Bonar Law | 445 | 382 | +111 | 54.0 | 38.4 | 4,003,848 | −8.2 | ||
| | Coalition Liberal | David Lloyd George | 145 | 127 | +127 | 18.0 | 12.6 | 1,318,844 | N/A | ||
| | Coalition National Democratic | George Nicoll Barnes | 18 | 9 | +9 | 1.3 | 1.5 | 156,834 | N/A | ||
| | Coalition Labour | N/A | 5 | 4 | +4 | 0.1 | 0.4 | 40,641 | N/A | ||
| | Coalition Independent | N/A | 1 | 1 | +1 | 0.1 | 0.1 | 9,274 | N/A | ||
Coalition Government (total) | David Lloyd George | 614 | 523 | +249 | 74.0 | 53.0 | 5,529,441 | +6.4 | |||
Non-Coalition parties | |||||||||||
| | Labour | William Adamson | 361 | 57 | +15 | 8.1 | 20.8 | 2,171,230 | +14.5 | ||
| | Liberal | H. H. Asquith | 277 | 36 | −236 | 5.1 | 13.0 | 1,355,398 | −31.2 | ||
| | Sinn Féin | Éamon de Valera | 102 | 73 | +73 | 10.3 | 4.6 | 476,458 | N/A | ||
| | Irish Parliamentary | John Dillon | 57 | 7 | −67 | 1.0 | 2.2 | 226,498 | −0.3 | ||
| | Independent Labour | N/A | 29 | 2 | +2 | 0.3 | 1.1 | 116,322 | +1.0 | ||
| | Independent | N/A | 42 | 2 | +2 | 0.3 | 1.0 | 105,261 | +1.0 | ||
| | National | Henry Page Croft | 26 | 2 | +2 | 0.3 | 0.9 | 94,389 | N/A | ||
| | Independent NFDSS | James Hogge | 30 | 0 | 0 | 0.0 | 0.6 | 58,164 | N/A | ||
| | Co-operative Party | William Henry Watkins | 10 | 1 | +1 | 0.1 | 0.6 | 57,785 | N/A | ||
| | Ind. Conservative | N/A | 17 | 1 | 0 | 0.1 | 0.4 | 44,637 | +0.3 | ||
| | Labour Unionist | Edward Carson | 3 | 3 | +3 | 0.4 | 0.3 | 30,304 | N/A | ||
| | Independent Liberal | N/A | 8 | 0 | 0 | 0.1 | 0.2 | 24,985 | +0.2 | ||
| | Agriculturalist | Edward Mials Nunneley | 7 | 0 | 0 | 0.0 | 0.2 | 19,412 | N/A | ||
| | National Democratic | George Nicoll Barnes | 8 | 0 | 0 | 0.0 | 0.2 | 17,991 | N/A | ||
| | NFDSS | James Hogge | 5 | 0 | 0 | 0.0 | 0.1 | 12,329 | N/A | ||
| | Belfast Labour | N/A | 4 | 0 | 0 | 0.0 | 0.1 | 12,164 | N/A | ||
| | National Socialist Party | H. M. Hyndman | 3 | 1 | +1 | 0.1 | 0.1 | 11,013 | N/A | ||
| | Highland Land League | N/A | 4 | 0 | 0 | 0.0 | 0.1 | 8,710 | N/A | ||
| | Women's Party | Christabel Pankhurst | 1 | 0 | 0 | 0.0 | 0.1 | 8,614 | N/A | ||
| | British Socialist Party | Albert Inkpin | 3 | 0 | 0 | 0.0 | 0.1 | 8,394 | N/A | ||
| | Independent Democratic | N/A | 4 | 0 | 0 | 0.0 | 0.1 | 8,351 | N/A | ||
| | NADSS | James Howell | 1 | 1 | +1 | 0.1 | 0.1 | 8,287 | N/A | ||
| | Independent Nationalist | N/A | 6 | 0 | 0 | 0.0 | 0.1 | 8,183 | +0.1 | ||
| | Socialist Labour | Tom Bell | 3 | 0 | 0 | 0.0 | 0.1 | 7,567 | N/A | ||
| | Scottish Prohibition | Edwin Scrymgeour | 1 | 0 | 0 | 0.0 | 0.0 | 5,212 | N/A | ||
| | Independent Progressive | N/A | 3 | 0 | 0 | 0.0 | 0.0 | 5,077 | N/A | ||
| | Ind. Labour and Agriculturalist | N/A | 1 | 0 | 0 | 0.0 | 0.0 | 1,927 | N/A | ||
| | Christian Socialist | N/A | 1 | 0 | 0 | 0.0 | 0.0 | 597 | N/A | ||
Votes summary
Seats summary
Maps

Results in Ireland. The Sinn Féin MPs did not take their seats in the House of Commons, and instead formed the Dáil Éireann (English: Assembly of Ireland).

Results in London
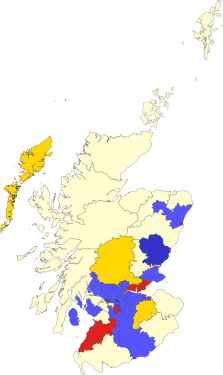
Results in Scotland


Transfers of seats
- All comparisons are with the December 1910 election.
- In some cases the change is due to the MP defecting to the gaining party. Such circumstances are marked with a *.
- In other circumstances the change is due to the seat having been won by the gaining party in a by-election in the intervening years, and then retained in 1918. Such circumstances are marked with a †.
| From | To | No. | Seats | ||
|---|---|---|---|---|---|
Labour | Labour (HOLD) | Burslem (replaced Staffordshire North West), Deptford, Plaistow (replaced West Ham South), Woolwich East (replaced Woolwich) | |||
Coalition Labour | Norwich (1 of 2), Stockport (1 of 2) | ||||
Coalition National Democratic | Hanley | ||||
Liberal | |||||
National Liberal | |||||
Conservative | Bow and Bromley†, Nuneaton | ||||
Sinn Féin | Nationalist | ||||
abolished | |||||
Nationalist | Nationalist | ||||
abolished | |||||
Lib-Lab | Coalition Liberal | Battersea North (replaced Battersea) | |||
Liberal | Labour | Forest of Dean, Leek, Wellingborough (replaced Northamptonshire Mid) | |||
National Democratic | Walthamstow W (replaced Walthamstow) | ||||
Liberal (HOLD) | Bermondsey West (replaced Bermondsey), Camborne, Cornwall North (replaced Launceston), Newcastle-under-Lyme, Norwich (1 of 2), Saffron Walden, Whitechapel and St Georges (replaced Whitechapel), Wolverhampton East | ||||
National Liberal | Banbury, Barnstaple, Bedford, Bethnal Green NE, Bristol East, Bristol North, Bristol South, Cambridgeshire (replaced Chesterton), Crewe, Dartford, Dorset East, Eye, Hackney Central, Isle of Ely (replaced Wisbech), Kennington, Lichfield, Stepney Limehouse (replaced Limehouse), Lowestoft, Luton, Norfolk South, Norfolk South West, Northampton (1 of 2), Peckham, Poplar South (replaced Poplar), Romford, St Ives, Shoreditch (replaced Hoxton), South Molton, Southampton (both seats), Southwark Central (replaced Newington West), Southwark North (replaced Southwark West), Southwark South East (replaced Walworth), Stockport (1 of 2), Stoke-upon-Trent, Stroud, Thornbury, Wellington (Salop) | ||||
Coalition Independent | Norfolk North | ||||
Independent | Hackney South | ||||
Conservative | Bedfordshire Mid (replaced Biggleswade), Bethnal Green South-West†, Buckingham, Camberwell North, Cheltenham†, Coventry, Exeter†, Frome, Gillingham (replaced Rochester), Ipswich (1 of 2)†, Islington East, Islington South, Islington West, Macclesfield, Norfolk East, Northwich, Peterborough, Reading†, Rotherhithe, St Pancras North, Stafford, Swindon (replaced Cricklade), Tottenham South (replaced Tottenham), Upton (replaced West Ham North), Westbury, Yeovil (replaced Somerset Southern)† | ||||
abolished | Finsbury East, Haggerston, Hyde, Ipswich (1 of 2), Newmarket, Norfolk North West, Northampton (1 of 2), Northamptonshire East, St Austell, St George, Tower Hamlets, St Pancras East, Stepney, Truro, Worcestershire North | ||||
Speaker | Liberal | ||||
Liberal Unionist | Conservative | Aylesbury*, Birmingham West*, Bodmin*, Burton*, Birmingham Handsworth*, Hythe*, Ludlow*, Portsmouth North (replaced 1 of 2 Portsmouth seats)*, Stepney Mile End (replaced Mile End)*, Birmingham Sparkbrook (replaced Birmingham South)*, Stone (replaced Staffordshire West)*, Torquay*, Totnes*, Westminster St George's (replaced St George, Hanover Square)* | |||
abolished | Ashburton, Birmingham Central, Birmingham North, Birmingham Bordesley, Droitwich, Norfolk Mid, Ross, Somerset Eastern, Worcestershire East | ||||
Conservative | Communist | ||||
Labour | Kettering (replaced Northamptonshire North), Kingswinford, Wednesbury, West Bromwich | ||||
Liberal | Lambeth North, Weston-super-Mare (replaced Somerset Northern) | ||||
Coalition Liberal | Sudbury | ||||
Conservative (HOLD) | Abingdon, Altrincham, Ashford, Birmingham Aston (replaced Aston Manor), Basingstoke, Bath (1 of 2), Bewdley, Bilston (replaced Wolverhampton South), Birkenhead East (replaced Birkenhead), Brentford and Chiswick (replaced Brentford), Bridgwater, Brighton (both seats), Bristol West, Brixton, Bury St Edmunds, Cambridge, Chatham, Chelmsford, Chelsea, Chertsey, Chester, Chichester, Chippenham, Cirencester and Tewkesbury (replaced Tewkesbury), Clapham, Colchester, Croydon South (replaced Croydon), Daventry (replaced Northamptonshire South), Devizes, Plymouth Devonport (replaced 1 of 2 Devonport seats), Dorset North, Dorset South, Dorset West, Dover, Plymouth Drake (replaced 1 of 2 Plymouth seats), Dudley, Dulwich, Ealing, East Grinstead, Eastbourne, Eddisbury, Birmingham Edgbaston, Enfield, Epping, Epsom, Birmingham Erdington (replaced Birmingham East), Essex South East, Evesham, Fareham, Faversham, Finsbury (replaced Finsbury Central), Fulham East (replaced Fulham), Gloucester, Gravesend, Great Yarmouth, Greenwich, Guildford, Hackney North, Hammersmith South (replaced Hammersmith), Hampstead, Harrow, Harwich, Hastings, Henley, Hereford, Hitchin, Holborn, Honiton, Hornsey, Horsham and Worthing (replaced Horsham), Huntingdonshire (replaced Huntingdon), Isle of Thanet, Isle of Wight, Islington North, Kensington North, Kensington South, Kidderminster, King's Lynn, Kingston upon Thames, Knutsford, Leominster, Lewes, Lewisham West (replaced Lewisham), City of London (both seats), Maidstone, Maldon, New Forest & Christchurch (replaced New Forest), Newbury, Norwood, Oswestry, Oxford, Paddington North, Paddington South, Penryn and Falmouth, Petersfield, Portsmouth South (replaced 1 of 2 Portsmouth seats), Reigate, Rugby, Rye, St Albans, St Marylebone (replaced Marylebone West), St Pancras South East (replaced St Pancras South), St Pancras South West (replaced St Pancras West), Salisbury, Sevenoaks, Shrewsbury, Stalybridge and Hyde (replaced Stalybridge), Plymouth Sutton (replaced 1 of 2 Plymouth seats), Tamworth, Taunton, Tavistock, Tiverton, Tonbridge (replaced Tunbridge), Uxbridge, Wandsworth Central (replaced Wandsworth), Warwick and Leamington, Watford, Wells, Westminster Abbey (replaced Westminster), Wimbledon, Winchester, Windsor, Wirral, Wolverhampton West, Woodbridge, Worcester, Wycombe | ||||
National | Bournemouth (replaced Christchurch)†, Walsall | ||||
| Silver Badge | Hertford† | ||||
abolished | Andover, Bath (1 of 2), Cirencester, Devonport (1 of 2), Marylebone East, Medway, Newport (Shropshire), Ramsey, St Augustine's, Stowmarket, Strand, Stratford upon Avon, Wellington (Somerset), Wilton, Wokingham, Woodstock | ||||
Ind. Conservative | Conservative | Canterbury† | |||
UUP | UUP | ||||
abolished | |||||
Irish Unionist | abolished | ||||
Seat created | Labour | Smethwick | |||
Coalition Labour | Cannock | ||||
National Socialist Party | Silvertown | ||||
National Democratic | Birmingham Duddeston, East Ham South | ||||
Liberal | Portsmouth Central, Stourbridge | ||||
Coalition Liberal | Camberwell North-West, East Ham North, Leyton East | ||||
Conservative | Acton, Aldershot, Balham and Tooting, Battersea South, Birkenhead West, Bristol Central, Bromley, Chislehurst, Croydon North, Birmingham Deritend, Edmonton, Farnham, Finchley, Fulham West, Hammersmith North, Hemel Hempstead, Hendon, Ilford, Birmingham King's Norton, Birmingham Ladywood, Lewisham East, Leyton West, Mitcham, Birmingham Moseley, Putney, Richmond (Surrey), Southend, Spelthorne, Stoke Newington, Stratford, Streatham, Surrey East, Tottenham North, Twickenham, Wallasey, Walthamstow East, Willesden East, Willesden West, Wood Green, Woolwich West, Birmingham Yardley | ||||
UUP | |||||
See also
1920 United States elections, the first held after the passage of the 19th amendment allowed American women to vote- United Kingdom general elections
- MPs elected in the United Kingdom general election, 1918
Parliamentary franchise in the United Kingdom 1885–1918, for details of the franchises replaced by the ones used in 1918
Notes
^ The Sinn Féin MPs did not take their seats in the House of Commons, and instead formed the Dáil Éireann.
^ The Conservative total includes 47 Conservative candidates elected without the Coalition Coupon, of whom 23 were Irish Unionists.
^ All parties shown.
References
^ J. M. McEwen, "The coupon election of 1918 and Unionist Members of Parliament." Journal of Modern History 34.3 (1962): 294-306.
^ Stuart R. Ball, "Asquith's Decline and the General Election of 1918." Scottish Historical Review 61.171 (1982): 44-61.
^ Barry McGill, "Lloyd George's Timing of the 1918 Election." Journal of British Studies 14.1 (1974): 109-124.
^ Paul Adelman, The decline of the Liberal Party 1910-1931 (2014).
^ Mary Hilson, "Women voters and the rhetoric of patriotism in the British general election of 1918" Women's History Review 10.2 (2001): 325-347.
^ Mowat 1955, p. 3.
^ Trevor Wilson, "The Coupon and the British General Election of 1918." Journal of Modern History 36.1 (1964): 28-42.
^ McEwen 1962, p. 295.
^ Taylor 1976, pp. 127–128.
^ Inbal Rose, Conservatism and foreign policy during the Lloyd George coalition 1918-1922 (2014).
^ Edward David, "The Liberal Party Divided 1916–1918." Historical Journal 13.3 (1970): 509-532.
^ Chris Wrigley, Lloyd George and the challenge of Labour: The post-war coalition, 1918-1922 (Harvester Wheatsheaf, 1990).
^ Blake, Robert The Unknown Prime Minister: The Life and Times of Andrew Bonar Law, 1858-1923, London: Faber and Faber, 2011 p.86.
^ Blake, Robert The Unknown Prime Minister: The Life and Times of Andrew Bonar Law, 1858-1923, London: Faber and Faber, 2011 p.86.
^ Mowat 1955, p. 9.
^ Cottrell, Peter The Anglo-Irish War: The Troubles of 1913–1922, London: Osprey, 2006 page 39.
^ Cottrell, Peter The Anglo-Irish War: The Troubles of 1913–1922, London: Osprey, 2006 page 29.
^ "Archived copy" (PDF). Archived from the original (PDF) on 8 July 2014. Retrieved 23 May 2014.CS1 maint: Archived copy as title (link) .mw-parser-output cite.citation{font-style:inherit}.mw-parser-output q{quotes:"""""""'""'"}.mw-parser-output code.cs1-code{color:inherit;background:inherit;border:inherit;padding:inherit}.mw-parser-output .cs1-lock-free a{background:url("//upload.wikimedia.org/wikipedia/commons/thumb/6/65/Lock-green.svg/9px-Lock-green.svg.png")no-repeat;background-position:right .1em center}.mw-parser-output .cs1-lock-limited a,.mw-parser-output .cs1-lock-registration a{background:url("//upload.wikimedia.org/wikipedia/commons/thumb/d/d6/Lock-gray-alt-2.svg/9px-Lock-gray-alt-2.svg.png")no-repeat;background-position:right .1em center}.mw-parser-output .cs1-lock-subscription a{background:url("//upload.wikimedia.org/wikipedia/commons/thumb/a/aa/Lock-red-alt-2.svg/9px-Lock-red-alt-2.svg.png")no-repeat;background-position:right .1em center}.mw-parser-output .cs1-subscription,.mw-parser-output .cs1-registration{color:#555}.mw-parser-output .cs1-subscription span,.mw-parser-output .cs1-registration span{border-bottom:1px dotted;cursor:help}.mw-parser-output .cs1-hidden-error{display:none;font-size:100%}.mw-parser-output .cs1-visible-error{font-size:100%}.mw-parser-output .cs1-subscription,.mw-parser-output .cs1-registration,.mw-parser-output .cs1-format{font-size:95%}.mw-parser-output .cs1-kern-left,.mw-parser-output .cs1-kern-wl-left{padding-left:0.2em}.mw-parser-output .cs1-kern-right,.mw-parser-output .cs1-kern-wl-right{padding-right:0.2em}
Further reading
.mw-parser-output .refbegin{font-size:90%;margin-bottom:0.5em}.mw-parser-output .refbegin-hanging-indents>ul{list-style-type:none;margin-left:0}.mw-parser-output .refbegin-hanging-indents>ul>li,.mw-parser-output .refbegin-hanging-indents>dl>dd{margin-left:0;padding-left:3.2em;text-indent:-3.2em;list-style:none}.mw-parser-output .refbegin-100{font-size:100%}
- Adelman, Paul. The decline of the Liberal Party 1910-1931 (2014).
Ball, Stuart R. (1982), "Asquith's Decline and the General Election of 1918", Scottish Historical Review, 61 (171): 44–61, JSTOR 25529447
Craig, F. W. S. (1989), British Electoral Facts: 1832–1987, Dartmouth: Gower, ISBN 0900178302
- Hilson, Mary. "Women voters and the rhetoric of patriotism in the British general election of 1918" Women's History Review 10.2 (2001): 325-347.
McEwen, J. M. (1962), "The Coupon Election of 1918 and Unionist Members of Parliament", Journal of Modern History, 34 (3): 294–306, JSTOR 1874358
- McGill, Barry. "Lloyd George's Timing of the 1918 Election." Journal of British Studies 14.1 (1974): 109-124.
Mowat, Charles Loch (1955), Britain between the wars, 1918–1940, Chicago: University of Chicago Press, pp. 2–9
Taylor, A. J. P. (1976), English History, 1914–1945, New York: Oxford University Press, pp. 127–128, ISBN 0198217153
Turner, John (1992), British Politics and the Great War: Coalition and Conflict, 1915–1918, New Haven: Yale University Press, pp. 317–333, 391–436, ISBN 0300050461, covers the campaign as well as a statistical analysis of the vote
Wilson, Trevor (1964), "The Coupon and the British General Election of 1918", Journal of Modern History, 36 (1): 28–42, JSTOR 1874424
External links
| Wikimedia Commons has media related to 1918 UK General Election. |
- Spartacus: Political Parties and Election Results
- United Kingdom election results—summary results 1885–1979
Manifestos
- 1918 Conservative manifesto
- 1918 Labour manifesto
- 1918 Liberal manifesto
- 1918 Sinn Féin manifesto
| General elections |
|
|---|---|
| Local elections |
|
| European elections |
|
| Referendums |
|


