Fermanagh and South Tyrone (Assembly constituency)
Coordinates: 54°32′31″N 7°18′32″W / 54.542°N 7.309°W / 54.542; -7.309
| Fermanagh and South Tyrone | |
|---|---|
Northern Ireland Assembly Parliamentary Constituency | |
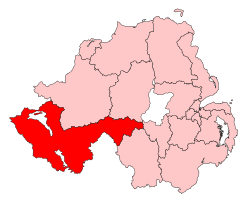 Fermanagh and South Tyrone shown within Northern Ireland | |
| Current constituency | |
| Created | 1973 |
| Seats | 5 (2017–) 6 (1996–2016) |
| MLAs |
|
| Districts | Fermanagh and Omagh District Council |
| EP constituency | Northern Ireland |
Fermanagh and South Tyrone (Irish: Fear Manach agus Tír Eoghain Theas, Ulster Scots: Fermanay an Sooth Owenslann) is a constituency in the Northern Ireland Assembly.
It was first used for a Northern Ireland-only election in 1973, which elected the then Northern Ireland Assembly. It usually shares boundaries with the Fermanagh and South Tyrone UK Parliament constituency. However, the boundaries of the two constituencies were slightly different from 1983 to 1986 (because the Assembly boundaries had not caught up with Parliamentary boundary changes) and from 1996 to 1997, when members of the Northern Ireland Forum had been elected from the newly drawn Parliamentary constituencies but the 51st Parliament of the United Kingdom, elected in 1992 under the 1983-95 constituency boundaries, was still in session.
Members were then elected from the constituency to the 1975 Constitutional Convention, the 1982 Assembly, the 1996 Forum and then to the current Assembly from 1998.
For further details of the history and boundaries of the constituency, see Fermanagh and South Tyrone (UK Parliament constituency).
Contents
1 Members
2 Elections
2.1 Northern Ireland Assembly
2.1.1 2017
2.1.2 2016
2.1.3 2011
2.1.4 2007
2.1.5 2003
2.1.6 1998
2.2 1996 Forum
2.3 1982
2.4 1975
2.5 1973
3 References
Members
| Election | MLA (Party) | MLA (Party) | MLA (Party) | MLA (Party) | MLA (Party) | MLA (Party) | ||||||
|---|---|---|---|---|---|---|---|---|---|---|---|---|
1973 | 5 seats 1996-1998 | Thomas Daly (SDLP) | Austin Currie (SDLP) | Harry West (UUP) | John Taylor (UUP) | Ernest Baird (Vanguard) | ||||||
1975 | John McKay (UUP) | |||||||||||
1982 | Owen Carron (Sinn Féin) | Ken Maginnis (UUP) | Raymond Ferguson (UUP) | Ivan Foster (DUP) | ||||||||
1996 | Gerry McHugh (Sinn Féin) | Tommy Gallagher (SDLP) | Sam Foster (UUP) | Maurice Morrow (DUP) | ||||||||
1998 | Michelle Gildernew (Sinn Féin) | Joan Carson (UUP) | ||||||||||
2003 | Tom O'Reilly (Sinn Féin) | Tom Elliott (UUP) | Arlene Foster (UUP/ DUP) | |||||||||
2007 | Gerry McHugh (Sinn Féin) | |||||||||||
2011 | Seán Lynch (Sinn Féin) | Phil Flanagan (Sinn Féin) | ||||||||||
July 2012 co-option | Bronwyn McGahan (Sinn Féin) | |||||||||||
June 2015 co-option | Neil Somerville (UUP) | |||||||||||
January 2016 co-option | Alastair Patterson (UUP) | |||||||||||
2016 | Michelle Gildernew (Sinn Féin) | Richie McPhillips (SDLP) | Rosemary Barton (UUP) | |||||||||
2017 | Jemma Dolan (Sinn Féin) | 5 seats 2017-present | ||||||||||
June 2017 co-option | Colm Gildernew (Sinn Féin) | |||||||||||
Note: The columns in this table are used only for presentational purposes, and no significance should be attached to the order of columns. For details of the order in which seats were won at each election, see the detailed results of that election.
Elections
Northern Ireland Assembly
2017
2017 Assembly election: Fermanagh and South Tyrone - 5 seats[1] | |||||||
|---|---|---|---|---|---|---|---|
| Party | Candidate | % 1st Pref | Count 1 | Count 2 | Count 3 | Count 4 | |
DUP | Arlene Foster | 16.2 | 8,479 | 8,745 | |||
Sinn Féin | Michelle Gildernew | 15.3 | 7,987 | 8,228 | 9,385 | ||
Sinn Féin | Jemma Dolan | 14.9 | 7,767 | 8,023 | 8,928 | ||
UUP | Rosemary Barton | 11.6 | 6,060 | 6,863 | 8,334 | 8,442 | |
Sinn Féin | Seán Lynch | 12.0 | 6,254 | 6,338 | 7,174 | 7,717 | |
DUP | Maurice Morrow | 13.6 | 7,102 | 7,332 | 7,405 | 7,411 | |
SDLP | Richie McPhillips | 9.8 | 5,134 | 6,276 | |||
Alliance | Noreen Campbell | 2.8 | 1,437 | ||||
TUV | Alex Elliott | 1.5 | 780 | ||||
Labour Alternative | Donal Ó Cófaigh | 1.2 | 643 | ||||
Green (NI) | Tanya Jones | 1.1 | 550 | ||||
NI Conservatives | Richard Dunn | 0.1 | 70 | ||||
Electorate: 73,100 Valid: 52,263 Spoilt: 812 (1.53%) Quota: 8,711 Turnout: 72.61% | |||||||
2016
2016 Assembly election: Fermanagh and South Tyrone - 6 seats | ||||||||||
|---|---|---|---|---|---|---|---|---|---|---|
| Party | Candidate | % 1st Pref | Count 1 | Count 2 | Count 3 | Count 4 | Count 5 | Count 6 | Count 7 | |
DUP | Arlene Foster | 18.7 | 8,801 | |||||||
DUP | Maurice Morrow | 14.1 | 6,602 | 8,072.85 | ||||||
Sinn Féin | Michelle Gildernew | 14.0 | 6,614 | 6,625.73 | 6,628.37 | 6,838.37 | ||||
UUP | Rosemary Barton | 6.4 | 3,018 | 3,302.74 | 3,973.08 | 4,750.48 | 4,759.94 | 7,659.94 | ||
Sinn Féin | Seán Lynch | 10.1 | 4,782 | 4,784.07 | 4,784.95 | 4,845.56 | 6,551.02 | 6,557.81 | 6,565.81 | |
SDLP | Richie McPhillips | 8.5 | 4,014 | 4,032.63 | 4,049.35 | 4,653.84 | 4,823.53 | 5,205.63 | 6,107.23 | |
Sinn Féin | John Feely | 8.5 | 4,002 | 4,003.15 | 4,004.25 | 4,088.08 | 5,581.91 | 5,585.57 | 5,590.37 | |
UUP | Alastair Patterson | 6.4 | 3,010 | 3,140.41 | 3,563.25 | 4,205.18 | 4,207.18 | |||
Sinn Féin | Phil Flanagan | 7.3 | 3,449 | 3,452.45 | 3,452.67 | 3,510.97 | ||||
TUV | Donald Crawford | 2.5 | 1,164 | 1,223.11 | 1,381.95 | |||||
Green (NI) | Tanya Jones | 1.9 | 897 | 908.73 | 919.73 | |||||
Alliance | Kerri Blyberg | 1.1 | 539 | 545.21 | 552.91 | |||||
NI Labour | Damien Harris | 0.6 | 285 | 287.07 | 290.37 | |||||
Electorate: 74,257 Valid: 47,177 Spoilt: 757 Quota: 6,740 Turnout: 47,934 (64.55%) | ||||||||||
2011
2011 Assembly Election: Fermanagh and South Tyrone - 6 seats | |||||||||
|---|---|---|---|---|---|---|---|---|---|
| Party | Candidate | % 1st Pref | Count 1 | Count 2 | Count 3 | Count 4 | Count 5 | Count 6 | |
Sinn Féin | Michelle Gildernew | 19.0 | 9,110 | ||||||
UUP | Tom Elliott | 14.4 | 6,896 | ||||||
DUP | Arlene Foster | 14.3 | 6,876 | ||||||
DUP | Maurice Morrow | 10.1 | 4,844 | 4,849.46 | 4,910.98 | 5,324.24 | 7,229.24 | ||
Sinn Féin | Seán Lynch | 10.7 | 5,146 | 6,247.10 | 6,278.52 | 6,469.00 | 6,475.04 | 6,476.04 | |
Sinn Féin | Phil Flanagan | 10.6 | 5,082 | 5,781.66 | 5,799.00 | 6,109.20 | 6,127.72 | 6,136.72 | |
SDLP | Tommy Gallagher | 9.6 | 4,606 | 4,947.64 | 5,304.08 | 5,639.22 | 5,940.74 | 6,074.74 | |
UUP | Kenny Donaldson | 4.9 | 2,366 | 2,368.60 | 2,525.86 | 3,200.64 | |||
TUV | Alex Elliott | 2.6 | 1,231 | 1,231.78 | 1,249.78 | ||||
Independent | Pat Cox | 2.1 | 997 | 1,049 | 1,104.78 | ||||
Alliance | Hannah Su | 1.8 | 845 | 871.78 | |||||
Electorate: 70,985 Valid: 47,999 Spoilt: 950 Quota: 6,858 Turnout: 48,949 (68.96%) | |||||||||
2007
2007 Assembly Election: Fermanagh and South Tyrone - 6 seats | |||||||||||
|---|---|---|---|---|---|---|---|---|---|---|---|
| Party | Candidate | % 1st Pref | Count 1 | Count 2 | Count 3 | Count 4 | Count 5 | Count 6 | Count 7 | Count 8 | |
DUP | Arlene Foster | 15.4 | 7,138 | ||||||||
Sinn Féin | Michelle Gildernew | 15.1 | 7,026 | ||||||||
UUP | Tom Elliott | 14.2 | 6,603 | 6,680.42 | |||||||
SDLP | Tommy Gallagher | 9.6 | 4,440 | 4,441.54 | 4,463.64 | 4,464.28 | 4,466.32 | 4,769.34 | 6,640 | ||
DUP | Maurice Morrow | 10.1 | 4,700 | 5,098.23 | 5,098.58 | 5,120.18 | 5,304.03 | 5,333.26 | 5,345.57 | 7,013.57 | |
Sinn Féin | Gerry McHugh | 11.0 | 5,103 | 5,103 | 5,277.10 | 5,277.10 | 5,278.25 | 5,665.80 | 5,747.25 | 5,776.64 | |
Sinn Féin | Seán Lynch | 10.1 | 4,704 | 4,704.42 | 4,819.92 | 4,819.96 | 4,821.96 | 5,066.91 | 5,139.16 | 5,188.38 | |
UUP | Kenny Donaldson | 5.4 | 2,531 | 2544.09 | 2544.44 | 2563.52 | 2676.46 | 2823.64 | 2887.01 | ||
SDLP | Vincent Currie | 4.4 | 2,043 | 2043.56 | 2065.26 | 2065.34 | 2069.46 | 2260.76 | |||
Independent Republican | Gerry McGeough | 1.8 | 814 | 814 | 824.80 | 824.80 | 826.80 | ||||
Alliance | Allan Leonard | 1.1 | 521 | 521.49 | 522.79 | 522.83 | 535.94 | ||||
Republican Sinn Féin | Michael McManus | 0.9 | 431 | 431.21 | 432.36 | 432.40 | 432.40 | ||||
UK Unionist | Robert McCartney | 0.8 | 388 | 393.39 | 393.64 | 395 | |||||
Electorate: 65,826 Valid: 46,442 Spoilt: 403 Quota: 6,636 Turnout: 46,845 (71.1%) | |||||||||||
2003
2003 Assembly Election: Fermanagh and South Tyrone - 6 seats | |||||||||||
|---|---|---|---|---|---|---|---|---|---|---|---|
| Party | Candidate | % 1st Pref | Count 1 | Count 2 | Count 3 | Count 4 | Count 5 | Count 6 | Count 7 | Count 8 | |
UUP | Tom Elliott | 13.4 | 6,181 | 6,284 | 7,372 | ||||||
SDLP | Tommy Gallagher | 10.3 | 4,735 | 4,984 | 5,003 | 5,034.95 | 7,359.95 | ||||
Sinn Féin | Michelle Gildernew | 14.1 | 6,489 | 6,562 | 6,565 | 6,565 | 6,719 | ||||
UUP | Arlene Foster | 10.7 | 4,938 | 5,004 | 5,868 | 6,564.51 | 6,599.51 | ||||
DUP | Maurice Morrow | 12.0 | 5,536 | 5,546 | 5,670 | 5,684.20 | 5,689.91 | 8,669.91 | |||
Sinn Féin | Tom O'Reilly | 10.9 | 5,019 | 5,049 | 5,051 | 5,051 | 5,143 | 5,152 | 5,240 | 5,473.64 | |
Sinn Féin | Gerry McHugh | 9.5 | 4,393 | 4,432 | 4,436 | 4,436 | 4,594 | 4,602.71 | 4,691.71 | 5,211.50 | |
DUP | Bert Johnston | 6.7 | 3,094 | 3,113 | 3,133 | 3,139.39 | 3,162.81 | ||||
SDLP | Frank Britton | 6.0 | 2,772 | 2,978 | 2,994 | 3,011.75 | |||||
UUP | Robert Mulligan | 4.6 | 2,110 | 2,149 | |||||||
NI Women's Coalition | Eithne McNulty | 1.4 | 650 | ||||||||
Alliance | Linda Cleland | 0.5 | 243 | ||||||||
Electorate: 64,336 Valid: 46,160 Spoilt: 713 Quota: 6,595 Turnout: 46,873 (72.9%) | |||||||||||
1998
1998 Assembly Election: Fermanagh and South Tyrone - 6 seats | |||||||||||||
|---|---|---|---|---|---|---|---|---|---|---|---|---|---|
| Party | Candidate | % 1st Pref | Count 1 | Count 2 | Count 3 | Count 4 | Count 5 | Count 6 | Count 7 | Count 8 | Count 9 | Count 10 | |
SDLP | Tommy Gallagher | 15.9 | 8,135 | ||||||||||
UUP | Sam Foster | 10.9 | 5,589 | 5,686 | 5,690.20 | 5,859.90 | 7,494.90 | ||||||
Sinn Féin | Gerry McHugh | 10.7 | 5,459 | 5,481 | 5,576 | 5,886 | 5,899.30 | 5,914.50 | 9,096.50 | ||||
Sinn Féin | Michelle Gildernew | 9.2 | 4,703 | 4,712 | 4,755.30 | 4,893.60 | 4,894.60 | 4,896.60 | 5,168.80 | 6,894.55 | 8,501.55 | ||
DUP | Maurice Morrow | 7.8 | 3,987 | 3,999 | 4,001.80 | 4,011.10 | 4,097.10 | 6,522.30 | 6,525.60 | 6,527.37 | 6,595.06 | 6,627.06 | |
UUP | Joan Carson | 8.6 | 4,400 | 4,480 | 4,482.70 | 4,619.30 | 5,253.80 | 5,495.20 | 5,497.60 | 5,498.19 | 6,141.32 | 6,582.32 | |
UK Unionist | Jim Dixon | 8.3 | 4,262 | 4,268 | 4,268.50 | 4,299.80 | 4,365.90 | 4,879 | 4,883.10 | 4,884.28 | 4,957.84 | 5,000.84 | |
SDLP | Olive Mullen | 5.6 | 2,872 | 2,962 | 3,485.40 | 4,302.70 | 4,338.10 | 4,352.40 | 4,482.30 | 4,548.38 | |||
Sinn Féin | Pat Treanor | 7.0 | 3,552 | 3,559 | 3,585 | 3,707.70 | 3,711.30 | 3,711.30 | |||||
DUP | Bert Johnston | 6.1 | 3,095 | 3,102 | 3,103.30 | 3,119.90 | 3,309.20 | ||||||
UUP | Bertie Kerr | 5.1 | 2,583 | 2,633 | 2,636.70 | 2,720 | |||||||
NI Women's Coalition | Marie Crawley | 3.4 | 1,729 | 1,982 | 2,071.30 | ||||||||
Alliance | Stephen Farry | 1.2 | 614 | ||||||||||
Natural Law | Simeon Gillan | 0.1 | 63 | ||||||||||
Electorate: 65,383 Valid: 46,160 Spoilt: 880 Quota: 6,595 Turnout: 51,923 (79.4%) | |||||||||||||
1996 Forum
Successful candidates are shown in bold.[2]
| Party | Candidate(s) | Votes | Percentage | |
|---|---|---|---|---|
UUP | Ken Maginnis Sam Foster Joan Carson Bertie Kerr | 15,542 | 32.3 | |
Sinn Féin | Gerry McHugh Michelle Gildernew Robin Martin Vincent Kelly Pat Trainor | 11,666 | 24.2 | |
SDLP | Tommy Gallagher Anthony McGonnell Anne McQuillan Vincent Currie Mary Flanagan | 10,399 | 21.6 | |
DUP | Maurice Morrow Joseph Dodds | 6,589 | 13.7 | |
Alliance | Stephen Farry Julie Greaves | 831 | 1.7 | |
UK Unionist | Muriel Boston Robert Peden | 468 | 1.0 | |
Ulster Democratic | Raymond Gilliland Paul Longman | 464 | 1.0 | |
NI Women's Coalition | Roisin Keenan Audrey Johnston Florence Ellis | 461 | 1.0 | |
PUP | Tracy Gould Paul Ferguson | 410 | 0.9 | |
Labour coalition | Ciaran Molloy Patrick Mulholland Nigel Cooke | 297 | 0.6 | |
Green (NI) | Roy Hadden Roy Johnston Peg Alexander | 208 | 0.4 | |
Workers' Party | Tommy Owens Marian Donnelly | 199 | 0.4 | |
Ulster Independence | Simon Dilworth Stuart Boyd | 189 | 0.4 | |
Democratic Left | Gerry Cullen Doris Wray | 128 | 0.3 | |
Independent McMullan | Philip McClinchey Ann McDermott | 118 | 0.2 | |
NI Conservatives | William Quin Eric Milligan | 113 | 0.2 | |
Independent Chambers | William Chambers May Blayney | 36 | 0.1 | |
Natural Law | Charles Cunningham Simeon Gillen Peter Lavery | 23 | 0.0 | |
1982
1982 Assembly election: Fermanagh and South Tyrone - 5 seats | |||||||||||||
|---|---|---|---|---|---|---|---|---|---|---|---|---|---|
| Party | Candidate | % 1st Pref | Count 1 | Count 2 | Count 3 | Count 4 | Count 5 | Count 6 | Count 7 | Count 8 | Count 9 | Count 10 | |
Sinn Féin | Owen Carron | 23.7% | 14,025 | ||||||||||
UUP | Ken Maginnis | 17.1% | 10,117 | ||||||||||
UUP | Raymond Ferguson | 9.9% | 5,877 | 5,885 | 6,216 | 6,268 | 6,966 | 6,976 | 9,403 | 9,921 | |||
SDLP | Austin Currie | 11.5% | 6,800 | 7,093 | 7,259 | 7,717 | 7,758 | 8,374 | 9,403 | 8,383 | 12,402 | ||
DUP | Ivan Foster | 7.3% | 4,324 | 4,328 | 4,342 | 4,350 | 4,956 | 4,957 | 5,142 | 8,070 | 8,114 | 8,145 | |
Sinn Féin | Francie Molloy | 4.6% | 2,700 | 6,096 | 6,108 | 6,414 | 6,427 | 6,528 | 6,537 | 6,540 | 6,848 | 7,603 | |
SDLP | Joseph Maguire | 4.9% | 2,912 | 3,060 | 3,168 | 3,451 | 3,458 | 5,179 | 5,196 | 5,202 | |||
DUP | Bert Johnston | 5.0% | 2,965 | 2,966 | 2,986 | 2,990 | 3,336 | 3,337 | 3,559 | ||||
UUP | Cecil Noble | 4.4% | 2,597 | 2,602 | 2,684 | 2,706 | 2,964 | 2,970 | |||||
SDLP | Fergus McQuillan | 3.9% | 2,288 | 2,400 | 2,448 | 2,634 | 2,634 | ||||||
UUUP | Ernest Baird | 3.4% | 2,010 | 2,012 | 2,041 | 2,050 | |||||||
Workers' Party | Tommy Owens | 2.4% | 1,394 | 1,481 | 1,724 | ||||||||
Alliance | John Haslett | 2.0% | 1,171 | 1,177 | |||||||||
Electorate: 73,930 Valid: 59,180 Spoilt: 2,171 (3.54%) Quota: 9,864 Turnout: 82.99% | |||||||||||||
1975
1975 Constitutional Convention: Fermanagh and South Tyrone - 5 seats | ||||||||||||
|---|---|---|---|---|---|---|---|---|---|---|---|---|
| Party | Candidate | % 1st Pref | Count 1 | Count 2 | Count 3 | Count 4 | Count 5 | Count 6 | Count 7 | Count 8 | Count 9 | |
UUP | Harry West | 24.4 | 12,922 | |||||||||
SDLP | Austin Currie | 18.8 | 9,984 | |||||||||
Vanguard | Ernie Baird | 15.2 | 8,067 | 9,706.28 | ||||||||
SDLP | Thomas Daly | 13.5 | 7,145 | 7,147.79 | 8,063.98 | 8,063.98 | 8,103.66 | 8,708.95 | 9,322.95 | |||
UUP | John McKay | 6.0 | 3,194 | 5,111.66 | 5,113.20 | 5,487.12 | 5,817.15 | 5,825.75 | 6,365.48 | 6,376.26 | 9,836.48 | |
SDLP | Thomas Murray | 7.8 | 4,143 | 4,153.85 | 4,239.54 | 4,239.86 | 4,254.62 | 4,559.72 | 4,741.67 | 5,108.19 | 5,123.19 | |
DUP | David Calvert | 6.4 | 3,389 | 3,636.07 | 3.636.51 | 4,052.99 | 4,212.20 | 4,213.45 | 4,485.99 | 4,496.77 | ||
Alliance | Bill Barbour | 2.8 | 1,464 | 1,492.21 | 1,506.07 | 1,514.71 | 2,179.70 | 2,261.51 | ||||
Republican Clubs | Eugene Lyttle | 2.8 | 1,501 | 1,503.48 | 1,547.15 | 1,548.11 | 1,594.83 | |||||
Unionist Party NI | George Cathcart | 2.3 | 1,245 | 1,358.15 | 1,359.80 | 1,392.60 | ||||||
Electorate: 70,344 Valid: 53,054 Spoilt: 2,122 (3.8%) Quota: 8,843 Turnout: 55,176 (78.4%) | ||||||||||||
Note: Ernie Baird, David Calvert, John McKay and Harry West were all UUUC-endorsed candidates.
1973
1973 Assembly election: Fermanagh and South Tyrone - 5 seats | ||||||||||
|---|---|---|---|---|---|---|---|---|---|---|
| Party | Candidate | % 1st Pref | Count 1 | Count 2 | Count 3 | Count 4 | Count 5 | Count 6 | Count 7 | |
SDLP | Austin Currie | 19.4 | 11,016 | |||||||
Vanguard | Ernest Baird | 14.9 | 8,456 | 8,517 | 8,517.56 | 10,081.56 | ||||
UUP | John Taylor | 14.8 | 8,410 | 8,469 | 8,469.70 | 8,712.84 | 9,131.88 | 9,338.80 | 9,779.80 | |
SDLP | Thomas Daly | 13.2 | 7,511 | 7,552 | 8,324.80 | 8,329.08 | 8,329.08 | 8,694.22 | 9,360.50 | |
UUP | Harry West | 14.4 | 8,198 | 8,252 | 8,252.84 | 8,336.84 | 8,491.40 | 8,674.02 | 9,084.44 | |
SDLP | David McQuillan | 7.2 | 4,074 | 4,080 | 4,558.80 | 4,558.80 | 4,559.28 | 4,792.98 | 5,175.92 | |
Republican Clubs | James McQuaid | 5.1 | 2,923 | 2,930 | 3,046.62 | 3,049.76 | 3,050.24 | 3,109.64 | 3,561.40 | |
Independent | Jack Hassard | 3.5 | 2,008 | 2,068 | 2,190.36 | 2,209.36 | 2,219.92 | 3,076.86 | ||
Alliance | Patrick Reimill | 3.4 | 1,960 | 2,028 | 2,050.40 | 2,067.54 | 2,070.90 | |||
DUP | William Mitchell | 3.5 | 1,974 | 1,992 | 1,992.98 | |||||
Independent | David Brien | 0.7 | 396 | |||||||
Electorate: 68,733 Valid: 56,926 Spoilt: 1,222 Quota: 9,488 Turnout: 58,148 (84.6%) | ||||||||||
Note: Austin Currie, John Taylor and Harry West were all members of the House of Commons of Northern Ireland when it was prorogued in 1972.
References
^ "Statement of Persons Nominated". EONI. Retrieved 8 February 2017..mw-parser-output cite.citation{font-style:inherit}.mw-parser-output q{quotes:"""""""'""'"}.mw-parser-output code.cs1-code{color:inherit;background:inherit;border:inherit;padding:inherit}.mw-parser-output .cs1-lock-free a{background:url("//upload.wikimedia.org/wikipedia/commons/thumb/6/65/Lock-green.svg/9px-Lock-green.svg.png")no-repeat;background-position:right .1em center}.mw-parser-output .cs1-lock-limited a,.mw-parser-output .cs1-lock-registration a{background:url("//upload.wikimedia.org/wikipedia/commons/thumb/d/d6/Lock-gray-alt-2.svg/9px-Lock-gray-alt-2.svg.png")no-repeat;background-position:right .1em center}.mw-parser-output .cs1-lock-subscription a{background:url("//upload.wikimedia.org/wikipedia/commons/thumb/a/aa/Lock-red-alt-2.svg/9px-Lock-red-alt-2.svg.png")no-repeat;background-position:right .1em center}.mw-parser-output .cs1-subscription,.mw-parser-output .cs1-registration{color:#555}.mw-parser-output .cs1-subscription span,.mw-parser-output .cs1-registration span{border-bottom:1px dotted;cursor:help}.mw-parser-output .cs1-hidden-error{display:none;font-size:100%}.mw-parser-output .cs1-visible-error{font-size:100%}.mw-parser-output .cs1-subscription,.mw-parser-output .cs1-registration,.mw-parser-output .cs1-format{font-size:95%}.mw-parser-output .cs1-kern-left,.mw-parser-output .cs1-kern-wl-left{padding-left:0.2em}.mw-parser-output .cs1-kern-right,.mw-parser-output .cs1-kern-wl-right{padding-right:0.2em}
^ 1996 Candidates – Fermanagh and South Tyrone, Northern Ireland Elections
Northern Ireland Assembly | ||
|---|---|---|
| Assembly |
|   |
| Committees |
| |
| Constituencies |
| |
| Parties | Current:
| |
| Elections | ||
| Members |
| |
| Procedure |
| |
| See also |
| |


